

New year = time to innovate. I am delighted to say that our Google Analytics(GA) implementation has just got a little bit smarter this week. One of my work buddies and I have rolled out our innovation project so we can easily track the results of development releases in GA, automatically. We call this Google Analytics Development Annotations(GADA) and its the start of our journey to making GA more powerful, faster and more useful.
Welcome to the new world of “Google Analytics Development Annotations”. As part of my day job, I have set up our mission to help our customers track not just the 10% of their business that represents their E-commerce website, but their entire business operations that support that website. By just focusing on the sales results, companies are missing out on most of the picture and it’s resulting in less efficiency and being slower to respond to market.
What’s missing from Google Analytics.
If I have a fully tuned Google Analytics implementation, it gives me a lot about the website, but it doesn’t give me anything about the process and the cost that went into building that website. For me, it’s missing 3 key things:
- It still takes a lot of extra effort to see the website releases to see progress or return on investment.
- It involves a lot of manpower and analysis time to understand historically what improvements generated large upswing in my sales or conversion rate.
- It’s impossible to track metrics around how stable or easy to deploy our release environments are. ( ie how big our technical debt is for a site)
The reason that you would want to track above is clear – they are the single largest factors that contribute to the efficiency of a website’s development processes and where 90% of the websites cost comes from.
The prompt us to make tough observations like:
- If releases aren’t contributing more value than they are costing, then why are you bothering to make the changes?
- If I can’t see what worked before, then a website owner is missing out on a vast history of learning which can help drive future growth.
- If it’s hard to deploy changes to an environment – then it’s more difficult to keep agile and respond to the market. Websites languish and performance decreases.
To do this currently involves a lot of extra work:
- Keeping a separate system ( usually a Google Spreadsheet, wiki or Microsoft Excel file) which keeps track of releases and new features.
- Making sure that this system is accessible to everyone who needs it in an “easy to understand way”
- Making sure that developers/ release managers/ project managers keep the document up to date with every release. This is very difficult for companies that release weekly/monthly to make sure they keep things updated manually so manual steps like this usually gets missed.
Introducing Google Analytics Developer Annotations
The missing gap for me can be solved using our Google Analytics Developer Annotations. Like the name implies, it’s a set of annotations and resulting metrics which can give KPIs for the development processes and teams to help drive improvement, reduce technical debt and make sure that the development process remains agile.
The perfect setup for measuring the success of an agile development process is the ability to automatically notify Google Analytics of any new releases to the live site and be able to give extra information about that release to drive actionable insight.
-
- Making sure that Google knows what’s in the releases
-
- Features – ( Sourced from GitHub tickets)
-
- Ideally a brief human-readable summary of the purpose of the release.
- (Optionally) Release version number?
-
- Making sure that Google knows what’s in the releases
- (Optionally) if a deployment to live didn’t happen, it would be useful to understand why. Maybe that might help to show as a measure tech quality/ technical debt in a project. Both of which are notoriously difficult to quantify but cost businesses a lot of money.
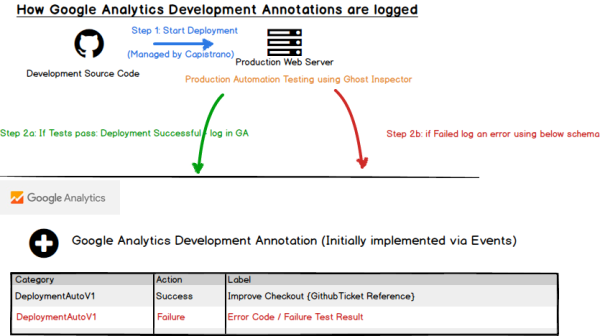
The measurement and implementation strategy behind GADA can best be described by this illustration:
Building our MVP
 They say that timing is everything and at the same time that I was working on this, I was also doing a project with one of my colleagues, Steven Richardson(@mage_gizmo), who was looking at how to automate testing as part of our release processes. We put our heads together and within a few weeks we had an approach for how we could create these Developer Annotations in Google Analytics. Thanks to the awesome Google Analytics Measurement Protocol – this was quite easy to build. ( if you want to know more about GA MP then look at my Slideshare) In addition, we also found a way to see when deployments were successful or if they failed, what was the test that failed directly in GA.
We gave this first version of the plugin the cheeky name of Dash Inspector – purely because we couldn’t think of anything cooler. (yet!)
Results
The following were created using a test environment and our MVP for tracking releases to GA. We haven’t used any customer or production data.
Tracking Developer Releases completed in a typical week:
As you can see from the below event category, we completed 36 overall releases with half resulting in an error and half being successful. 2 of the deployments weren’t tracked due to a GA glitch which we have since resolved. We have now got a really strong way to compare, just how often our sites are releasing and can decide if we are being as efficient and responsive to change.
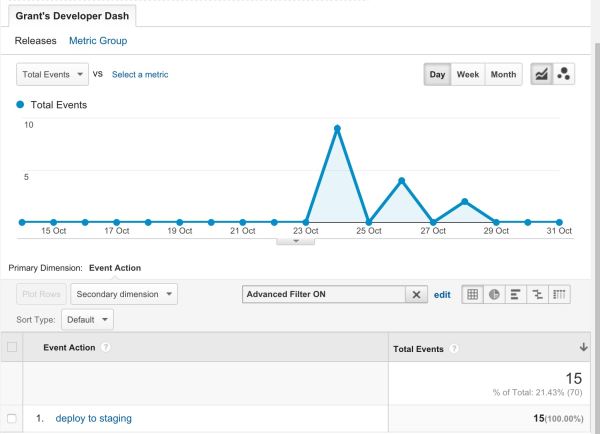
Tracking the health of which environment we are deploying to
Typically for most large builds, there are multiple environments that need to be used before code is pushed live. It is almost impossible to put a metric against how healthy an environment is in comparison to another. With GADA, this is easy to achieve. As a bonus, we have also added the ability to track not just deployments to live but to staging as well. Using a simple event Action filter we can zoom into just the deployments that were done to our staging environment. This will allow us to see:
- how successful our quality assurance has been on the build,
- if an error that was found in live was previously tracked in staging,
- or create an “Environment health” index or ratio by comparing the success of each environment at being able to receive a fully tested release. If deployments are succeeding in development and integration environments then you can now easily compare the release when it goes out on staging and live environments. If the failure rate is higher than a benchmark number, then you know its time to invest in improving your environments. Something which is typically very difficult to validate can now be added as a metric to a dashboard automatically.
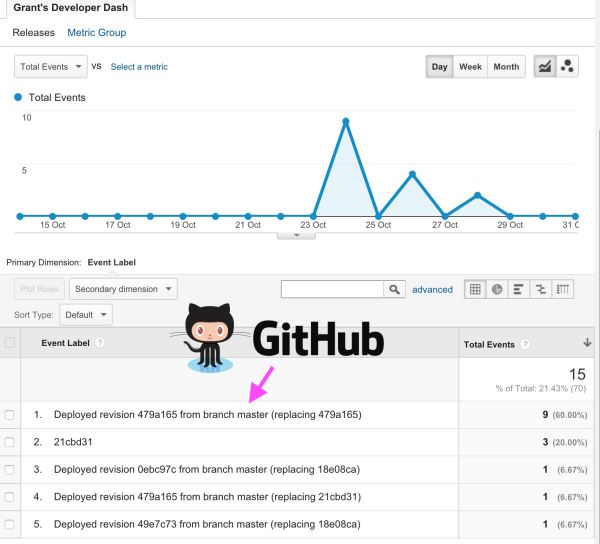
Tracking what was released
This for me is the magic bit. We can now easily see what was deployed ( ie what GitHub release). Until Google gets down to releasing a proper Annotations API, we are limited in what we can do. NB a “pure” annotations API is something which myself and 467 ( and counting) of my buddies have asked for on the Google code site – so please hurry up Google. In the meantime, we have a robust way of seeing exactly what was deployed without needing the manual intervention of adding in annotations. We can now see exactly what revision caused the improvement in the conversion on the checkout that made us a load of extra money from customers.
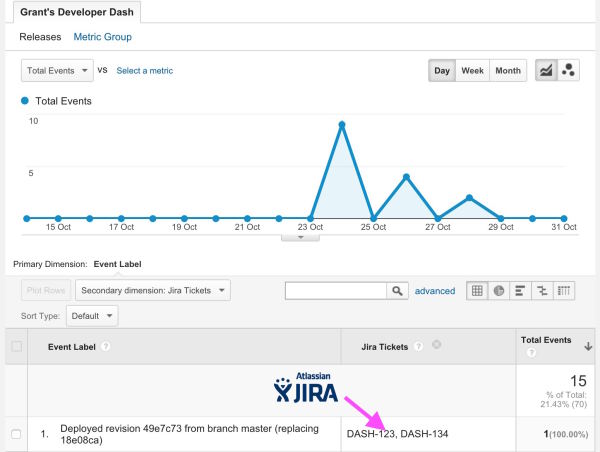
But GitHub revisions are only so useful – what I really want to see is what Jira tickets were pushed out with that revision, so I can easily identify the features without needing to go through the pain that comes from reading through GitHub logs.
Well, we did that too!
 Over to you, for your feedback please!
There are many more features that I can show – such as how we track errors that prevent deployment but I would prefer to rather pass out the work we have done to a wider audience to get your opinion. It’s available and free for you to try it on your own projects.
- It’s been built as an open source project,
- The source code and documentation are available on the Capistrano ghost inspector GitHub page.
- It can also be installed via a”ruby Gems” plugin which has managed to get over 1880 downloads so far
To share feedback – please raise an issue on GitHub or get in touch via the comments section below or the Get in Touch link above.